Open Data for All:
User Stories
In the 2015 Open Data Plan, Mayor de Blasio’s administration declared Open Data for All, an ambitious vision for a future where open data is not just available but useful to everyone. On the fifth anniversary of the Open Data Law, New York City’s Chief Analytics Officer made a promise: going forward, the public face of Open Data will not be a City official, but rather New Yorkers who have used public City data to improve their lives and their communities. In line with this promise, we present here stories of New Yorkers who have used Open Data to make a difference in all five boroughs.
These examples do not capture all the stories of New Yorkers using Open Data. Tell us yours. We encourage you to get in touch, and share your own Open Data story with our team.

Community Solutions: Brownsville Partnership
NYC Open Data has been a crucial component of Mary Tobin’s work addressing homelessness by increasing the incomes of at-risk individuals and families in her Brooklyn neighborhood. Mary graduated from West Point and served in Baghdad as a Communications Officer for the U.S. Army, and later worked for the U.S. Department of Housing and Urban Development. In January 2017, she was named the Director of The Brownsville Partnership, a project of Community Solutions that works to change the conditions that make residents of the Brownsville neighborhood in Brooklyn vulnerable to homelessness. She came in with a bold objective: “I decided to put my flag in the ground around dramatically impacting the unemployment rate in Brownsville,” she says.
Mary describes herself as a “data person” drawing on analytical communication skills she attributes to her time in Iraq. “Open Data has given me access to information on crucial cohorts,” she says, referring to youth ages 16 through 24, single mothers, and those formerly incarcerated individuals. Data from Administration for Children’s Services on childcare issues, Department of Education data on school performance, and Department of Probation data on juvenile offenders, along with demographic data from the federal census, help Mary focus resources most effectively on the populations she targets.
The Brownsville Partnership convenes stakeholders from local workforce agencies, healthcare institutions, and social service organizations to work as a team to open opportunities and improve the quality of life for Brownsville residents. Without data, understanding issues at the hyperlocal-level relied on piecemeal and anecdotal information. Open Data supplied “critical data pieces” to build a more holistic picture. For instance, geographically-specific data from the NYPD show that most major crimes in Brownsville have gone down significantly over the last two to three years; however, domestic violence in South Brownsville has gone up. Open Data helps tell local, evidence-based stories about the community, which has proven essential to calling community members and organizations to collective action and to raising funds for their community efforts.
Working with VizAlytics, Mary built an initial data dashboard which is becoming the centerpiece of what she refers to as the “data command center.” This will be a physical space with data visualizations to inform residents and community partners about what is happening in Brownsville, using regularly refreshed neighborhood indicators based on Open Data. The geographic information software provider Esri is now lending its help as well. Mary says that community partners appreciate the centralization of up-to-date indicators on the dashboard, which serves an important communication function: the conversations that happen over the data visualizations help partners collaborate to move the needle on issues of common concern, and the community feedback prompted by the data helps Mary fine-tune what is included on the dashboard. On the importance of Open Data in this feedback loop, Mary says, “It’s everything, it’s the foundation.”
Mary is also a partner in the Mayor’s Neighborhood Innovation Lab (NIL), an initiative to build a community ideas lab addressing neighborhood concerns through cutting-edge technology. A founding member of the NIL’s Brownsville Community Technology Advisory Board, Mary and other partners will use Open Data, along with other data sources, to evaluate the effectiveness of the pilots. Open Data-savvy advisors like Mary are critical to the process.

When Engagement Works: Beyond the TreesCount! 2015 Data Jam
In June 2016, the NYC Department of Parks and Recreation teamed up with BetaNYC, MODA, and the Mayor’s Office of Technology and Innovation to host the “TreesCount! Data Jam,” where the community groups that collected TreesCount! data joined civic hackers to collaborate and use the 2015 street tree census data to solve problems. One of the challenges NYC Parks posed to attendees was: “How can we use Street Tree Census Data to better engage with and target the efforts of community stewardship volunteers to improve the health of the urban forest?” Participants Rob Elliott and Nandan Shetty were members of “When Engagement Works,” the grand prize-winning team for that challenge.
Nandan is a doctoral student in engineering who also works part-time at NYC Parks’ Forestry, Horticulture & Natural Resources division. Rob, an Earth Institute Postdoctoral Fellow at Columbia University, wrote his PhD dissertation on green infrastructure, and has spent much of his academic career thinking about municipal greenery. Of the Data Jam, Rob says, “It was really cool to see what people who didn’t have their heads buried in street trees for a year had to offer. They brought a very new perspective to it, and lots of cool ideas came out.”
“We built a hydrologic model that could turn the Tree Census data into a model of water retention,” Nandan says. In other words, the team’s data analysis demonstrated how healthy trees in New York City contribute to better stormwater management. The results showed that installing more tree guards improved both tree health and the cost effectiveness of stormwater management — and that only 14 percent of NYC’s 666,000 street trees had useful treeguards — signs of community stewardship of those trees.
In a traditional hackathon, participants come together to work on a problem and then submit the results to the organizers at the end of the day-long event. Rob and Nandan’s experience was different, in that their work continued long after the Data Jam. NYC Parks supported them in honing their research pitch, and invited them to present their results to Parks officials, following a model for deeper engagement that prioritizes ongoing rather than one-off collaboration. In July 2016, Rob and Nandan presented their project to the First Deputy Commissioner and Forestry Directors at NYC Parks; in that presentation, they showed that their work could justify more funding to implement tree guards, although more research was needed.
Recently, NYC Parks has sought potential funding for further research on this project through cooperation with the NYC Department of Environmental Protection and the United States Geological Survey. Nandan and Rob used the results from their original model to calculate cost-benefit analyses that justified continued research and involvement. The City and Federal departments are now developing study designs and parameters for multiple quantitative studies utilizing data from Nandan and Rob’s Data Jam project.
These results were made possible by the high level of data accuracy in the TreesCount! street tree census. TreesCount! 2015 used an innovative approach that combined site surveying with geospatial technology to derive accurate tree locations. This allowed more than 2,200 volunteers to help NYC create a comprehensive and reliable map of the urban forest.
The TreesCount! 2015 project — and Rob and Nandan’s engagement with it — represents the full cycle of Open Data’s impact. TreesCount! 2015 engaged volunteers to help NYC manage the City’s urban forest – from data collection, to analysis, to operational impact – showing how Open Data is more than a momentary step; it’s an ongoing and deeper-level engagement between residents and government.
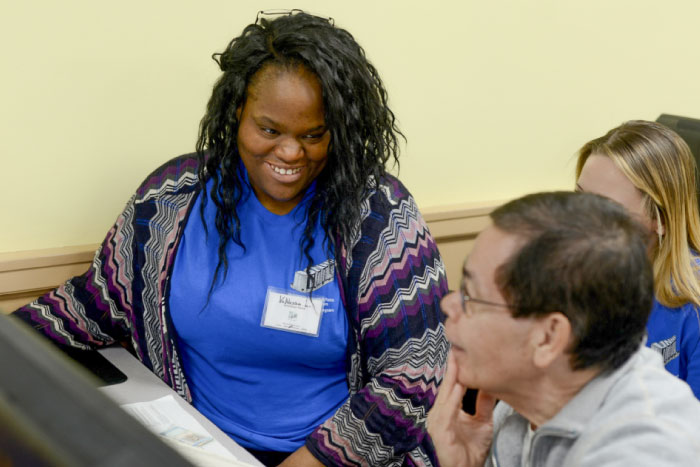
VaNessa LaNier
Manager of Data and Research, University Neighborhood Housing Program
In the Northwest Bronx, Open Data has played a major role in the efforts of University Neighborhood Housing Program (UNHP) to draw attention to multifamily residences that are physically or financially distressed. As the Program’s VaNessa LaNier explains, Open Data is “a great resource to address a specific problem, and a great research tool to enforce the work that we do and make it stronger.” By retrieving data from the Open Data Portal and other municipal sources, VaNessa and her team have created a database of distressed properties that are in need of care. Known as the Building Indicator Project, the database compiles various indicators of stress, such as building code violations (Department of Building Violations), real property data (from the Automated City Register Information System’s Real Property Legals, Parties, and Masters sets), and emergency repair data from 311 complaints (311 Service Requests from 2010 to Present). Based on these wide-ranging indicators, the organization creates individual scores for each multifamily residence, rating their state of distress. By harnessing the various datasets available through Open Data, VaNessa and the UNHP are helping to highlight possible areas for change towards greater equity in housing for New Yorkers.
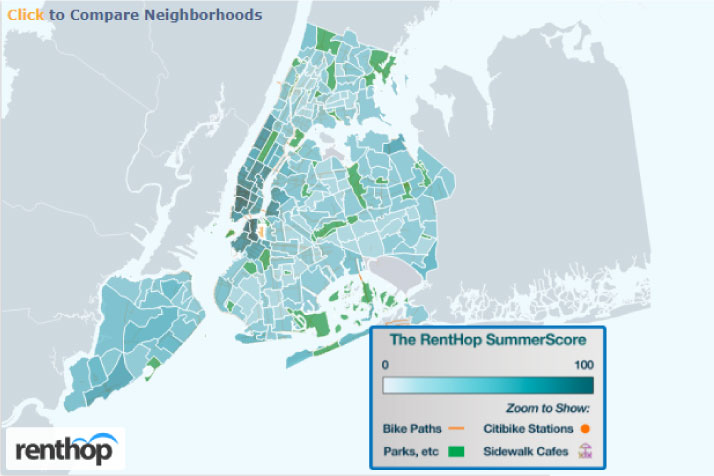
Shane Leese
Data Scientist, Renthop
NYC Open Data has helped content creators connect their personal experiences with City data to create interesting and informative publications. One of these creators is Shane Leese, a data scientist at real estate platform RentHop. Using Open Data, RentHop models 311 Service Requests from 2010 to Present and Neighborhood Tabulation Areas to create informative maps and articles that help people understand their neighborhoods. As Shane explains, NYC Open Data is helpful because he likes “using the open data to get a feel for what’s going on in different cities, and New York’s got a lot of datasets to choose from.” For Shane, everyday experiences have inspired dozens of data visualizations and studies on life in the city. For example, in one project, Shane tied together data on parks (Open Space), bike paths (Bike Routes), bike stations (CitiBike System Data), and sidewalk cafes (Legally Operating Businesses) to determine which was the best neighborhood for “summer fun.” RentHop, a minority-owned startup that came out of Y Combinator in 2009, has invested in Open Data as a form of business development. By using Open Data to tell compelling, relatable stories, RentHop is expanding its brand in both New York City and other cities.

NYC Civic Innovation Fellowship
New York City’s 59 Community Boards play an important role in local oversight of municipal service delivery. However, because each one is run by an average of just two full-time employees, along with volunteer representatives, many Community Boards struggle to engage effectively with the demands of the digital landscape. Manhattan Borough President Gale Brewer, a longtime champion of both Community Boards and Open Data, wants that to change. Her office partners with BetaNYC, CUNY Service Corps, the Fund for the City of New York, and Data & Society, with support from the Sloan Foundation, to operate the “NYC Civic Innovation Fellowship.” Each year, the program educates a select cohort of CUNY students in media theory, local history, and open data analysis while giving students hands-on experience developing civic technology for community board clients.
Shalom Joseph, who now works professionally as a data analyst, was a Fellow in the 2015-16 school year while a student at John Jay College of Criminal Justice. Lester Barrett, a rising junior at Medgar Evers College, was a Fellow the following year. Both studied computer science in college. Looking for professional experience in a technology field, they applied to the selective CUNY Service Corp Fellows, where they were accepted and found matches with Borough President Brewer’s NYC Civic Innovation Fellowship. For Lester and Shalom, it was their first exposure to data analytics through Open Data.
The fellowship curriculum, developed by BetaNYC, relies on Open Data to teach students data skills — a model of citizenship for a digital age. The curriculum is a crash course in the data created by City government operations. The two took part in 12-week boot camps, where they learned an array of data cleaning, analysis, and public speaking skills; the goal was to develop the skills for manipulating data in conjunction with the skills for communicating it. Telling stories by visualizing data was “an eye-opening experience,” Shalom explains. “It taught me that what we’re diving into is way bigger than just what we’re being taught right now.” By the end of the boot camp, both Lester and Shalom put their new skillsets to use, presenting “data stories” to community leaders based on City data, drawing especially from the records created by New Yorkers each day in the 311 Service Requests from 2010 to Present dataset.
Each cohort of the Civic Innovation Fellowship — which has now trained 25 undergraduates and has released seven hours of video and 100 pages of instructional material on how to use Open Data — builds on the work of the previous group. Currently, two prototypes for civic engagement technology are being deployed in Manhattan Community Boards.
Both Lester and Shalom found that NYC Open Data was critical to the Civic Innovation Fellowship, in both the skills they gained and their understanding of why those skills were relevant. “Without Open Data, we wouldn’t have had anything to do,” Shalom says. “We wouldn’t have had examples, we wouldn’t have had anything to go from, we wouldn’t have really had an understanding of why what we’re learning is important. The stories that are behind Open Data, everything that went into it, the people that were involved — it motivated me to really understand that as a New Yorker, this is something that I should pay attention to.”

Hadassah Damien
Manager of Engagement Technology The Participatory Budgeting Project
For the Participatory Budgeting Project (PBP), NYC Open Data has proven useful to informing and maintaining the democratic process of Participatory Budgeting. Hadassah Damien, PBP’s Manager of Engagement Technology explains, “There’s two ways I use Open Data in my work — I push others to provide more open data, and I pull by looking at open data that exists and seeing how it can be applied to my work.” In both ways, Open Data has been pivotal to the efforts of PBP to bring direct democracy to New Yorkers. Hadassah’s team at PBP has contributed to data publishing on Open Data by supporting the New York City Council staff and IT team to release information about community projects funded through participatory budgeting. This helps community members keep track of the implementation status of projects that they and their communities voted to fund. According to Hadassah, “One thing that’s great about the open datasets that are available is that they help people learn about their neighborhoods. Community members can use specific datasets that are on the Open Data website to look up the specific metrics about their neighborhood.” Hadassah has also worked to leverage Open Data from the Department of Health and Mental Hygiene to index indicators for public health by county to inform future participatory budgeting efforts to improve community health.
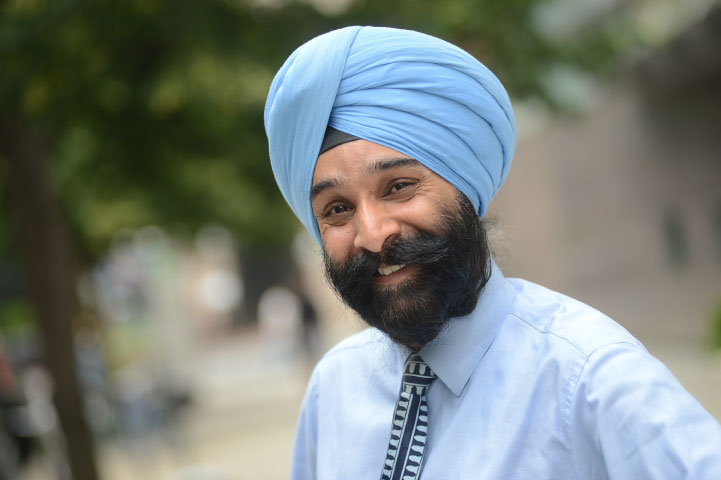
Harpreet Singh Wahan
Board Member, Queens Community Board 7 President and Founding Member of Flushing Interfaith Council
Harpreet Singh Wahan was among the community members who participated in an NYC Parks Open Data for All Workshop, based on a curriculum developed by BetaNYC. Harpreet, a Community Board Member in Queens, says Open Data is crucial for leaders who want to make a difference in their communities. “Thankfully, the Mayor has opened up this great information, which can be leveraged to optimize and make great policy decisions, whether it’s through analyzing tree populations or ethnographic data. Community leaders should be identified and trained, and they can in turn bring these learnings back to their communities,” he says. The president and founder of the Flushing Interfaith Council, Harpreet has high hopes for using Open Data to bring people and communities together in the future, especially those of different faiths. For Harpreet, “Open Data can help bridge the gaps between faiths and bridge our cultures.” He works with the Columbia Journalism School in a partnership to bring budding journalists to different houses of worship and introduce them to different religious faiths. In an effort to promote greater understanding of the diversity of religions in New York City and the world; Open Data has helped the partnership find previously unknown houses of worship.

Nada O’Neal
Vice President of Information Technology at ASPCA
For the American Society for the Prevention of Cruelty to Animals (ASPCA), geospatial datasets available on NYC Open Data have allowed their mapping specialists to overlay political boundaries on the organization’s NYC-specific service areas. Boundary shapefiles for borough, police precincts, and neighborhood tabulation areas, along with NYCHA locations and the street centerline files, “have helped us to better understand our communities we serve, and to ensure we are working in the areas of most critical need,” says Nada O’Neal, Vice President of Information Technology at ASPCA. Headquartered in New York City since it was founded over 150 years ago, ASPCA has a long history of partnering with the City, from efforts to improve law enforcement around animal abuse complaints (311 Service Requests from 2010 to present), to helping residents create pet emergency plans (Ready NY events), to increasing pet adoption, as when the ASPCA turned City Hall into “Kitty Hall” for a cat adoption event last month (NYC Permitted Event Information).
Share your feedback
Please share your reactions and ideas on this year's report by selecting "offer thoughts on this report" below. We also featured seven stories of New Yorkers using Open Data, but these examples are far from exhaustive. We want to hear from you: select "share your open data story" below to tell us how you use Open Data.
The comment period closed on September 1, 2017.
Powered by Screendoor.